Do Travel Sites Increase Prices on Repeat Visits?
In an age where digital footprints shape our online experiences, a pressing question has arisen among travelers… Does revisiting a travel website result in increased prices due to browser history? We embarked on an investigation, analyzing the pricing strategies of America’s leading travel websites. This study aimed to highlight whether prices escalate for those who frequently search for the same travel deals.
The study targeted the top travel companies in the US, identified through Semrush’s analysis of travel and tourism website traffic. We then employed two distinct Google Chrome accounts for our research. Browser A retained its cookies and cache, simulating the experience of a regular user. In contrast, Browser B underwent a thorough clearing of all history, cookies, cache, and site data between searches, representing a fresh user profile. Both browsers conducted the same price searches on the matching dates, Wi-Fi networks and location settings, ensuring a controlled comparison.
Booking.com – 1st
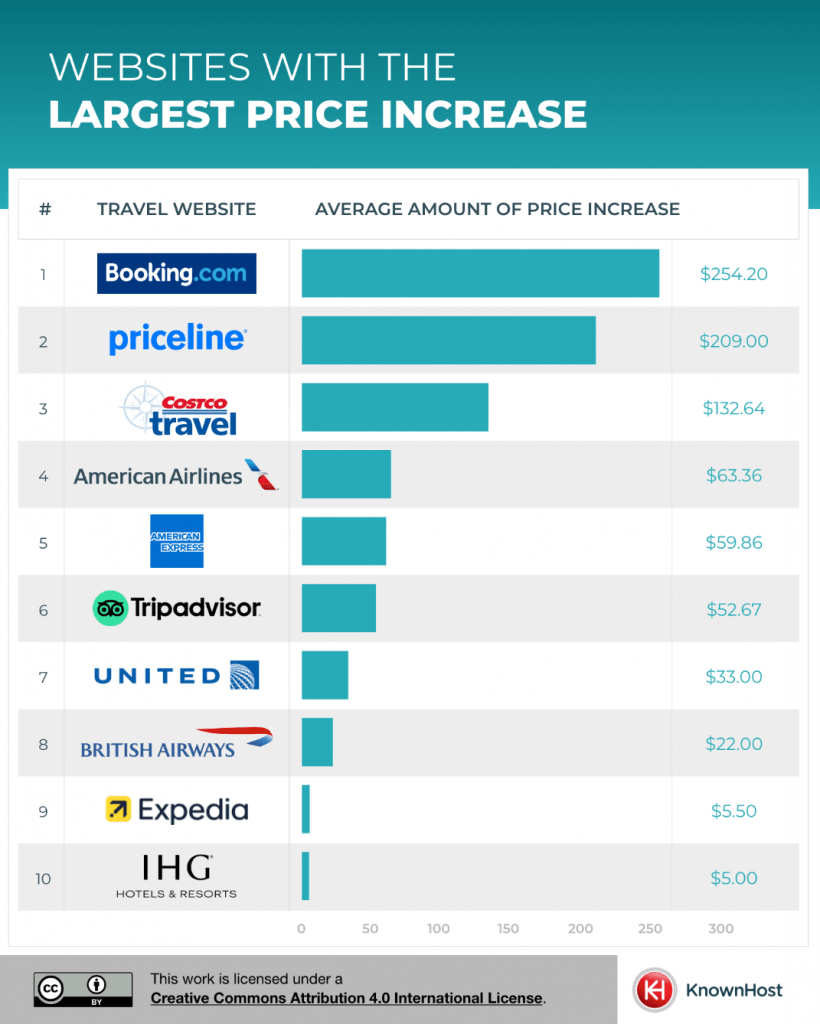
With an astounding average price increase of $254.20, Booking.com’s strategy appears to leverage user browsing history significantly. This increase may reflect Booking.com’s advanced algorithms and market position, enabling them to customize prices aggressively based on user interest and demand patterns.
Priceline – 2nd
Following closely, Priceline’s average markup of $209.00 suggests a similar yet slightly less aggressive approach compared to Booking.com. This indicates that while Priceline uses browsing history to inform pricing, it may also be balancing other factors, such as competitive pricing and customer retention strategies.
Costco Travel – 3rd
The average increase of $132.64 at Costco Travel, while lower than the top two, still indicates a significant use of user data for price adjustments. This might reflect Costco Travel’s focus on leveraging user behavior to optimize pricing, possibly due to its unique position as a part of a larger wholesale retail brand.
AA (4th) & American Express (5th)
Both airlines showed considerable increases, with $63.36 and $59.86 respectively. These figures suggest that airline websites might be more conservative in their use of dynamic pricing compared to hotel and travel booking platforms. However, they still acknowledge the importance of user data in setting prices.
Rest of the top 10:
Tripadvisor- 6th
Ranking sixth, Tripadvisor’s increase of $52.67 represents a more moderate use of browser history. This may reflect Tripadvisor’s role as a review and booking aggregator, where balancing user trust with revenue optimization is crucial.
United Airlines – 7th
With an increase of $33.00, United Airlines’ approach suggests a moderate influence of browsing data. This might be indicative of the airline industry’s overall strategy, which tends to be more conservative in price adjustments compared to other travel sectors.
British Airways- 8th
British Airways’ smaller increase of $22.00 points to a more conservative approach. This could be due to the brand’s positioning and customer base, or a strategic decision to focus on other aspects of customer experience beyond pricing.
Expedia – 9th
The minimal increase of $5.50 by Expedia suggests a limited, yet existing, use of dynamic pricing. This might be a strategic choice to maintain price stability and customer loyalty, indicating a different prioritization in their business model.
IHG – 10th
The least impactful increase of $5.00 at IHG indicates a potential minimal reliance on browser data for pricing. This could be a part of IHG’s strategy to emphasize consistent and transparent pricing to build customer trust and loyalty.
In summary, these rankings demonstrate the varying degrees of dynamic pricing strategies adopted by travel and airline websites. The spectrum ranges from aggressive price customization to more conservative strategies that prioritize customer trust and price stability, reflecting each company’s unique market position and business model priorities.
Costco Travel – 1st
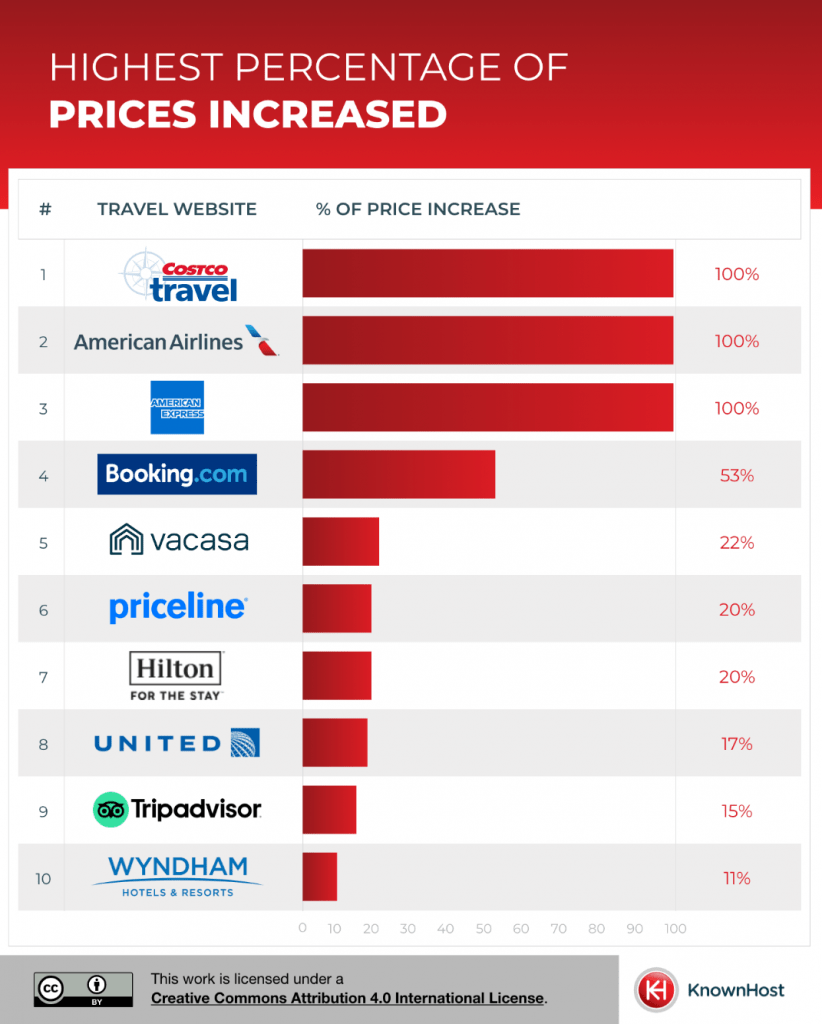
The 100% increase rate at Costcotravel.com is a strong indicator of their heavy reliance on search history for pricing. This dramatic shift could suggest that Costco Travel is employing an aggressive dynamic pricing model, possibly to capitalize on consumer interest and willingness to pay, which might be a reflection of their broader business model focused on tailored offerings.
AA (2nd) & American Express (3rd)
Both showing 100% increase rates, these platforms appear to employ a highly responsive pricing model based on user browsing history. This strategy could be reflective of their approach to capture maximum value from customers who show repeated interest, possibly indicating a focus on yield management in the highly competitive airline and credit card-linked travel services sector.
Booking.com – 4th
With a 53% increase rate, Booking.com’s strategy seems to be a nuanced balance between aggressive dynamic pricing and maintaining a competitive edge. This rate suggests that while Booking.com significantly utilizes user data for pricing, they may also be mindful of market competition and the risk of alienating price-sensitive customers.
Vacasa – 5th
The 22% increase rate indicates a potential, though less consistent, application of dynamic pricing based on user data. This could reflect Vacasa’s position in the vacation rental market, where pricing flexibility might be used as a tool to optimize occupancy rates and revenue, particularly in response to fluctuating demand.
Rest of the top 10:
Priceline – 6th
A 20% rate of price increase suggests a significant, though not universal, reliance on browsing data. This might reflect Priceline’s strategy of balancing dynamic pricing with the need to remain attractive in a highly competitive online travel agency market.
Hilton – 7th
Also at a 20% increase rate, Hilton’s approach could be indicative of a strategic use of browsing history to influence prices to a certain extent. This might be part of Hilton’s broader customer relationship and pricing strategy, balancing personalized pricing with brand loyalty incentives.
United Airlines – 8th
The 17% rate of price increase at United Airlines could indicate a moderate but strategic use of dynamic pricing based on user behavior. This rate might reflect United’s approach to optimize revenue per passenger while maintaining competitive fare structures in the airline industry.
Tripadvisor – 9th
With a 15% increase, Tripadvisor’s ranking suggests a moderate tendency to adjust prices based on browsing data. This might be part of their strategy to offer competitive pricing while leveraging user data to maximize revenue, balancing user trust as a review aggregator and a booking platform.
Wyndham Hotels – 10th
An 11% increase rate at Wyndham Hotels shows the least reliance on dynamic pricing strategies among the top 10. This could indicate Wyndham’s focus on maintaining stable pricing to uphold brand consistency and loyalty, possibly reflecting a more traditional approach in the hotel industry.
This study sheds light on the significant role browser history plays in shaping travel prices on various websites. Findings suggest travelers need strategic browsing habits, such as using different devices and regularly clearing browser cookies, to potentially uncover more favorable pricing options. In the fast-evolving digital landscape of travel, staying informed and adaptable can lead to smarter and more cost-effective travel planning.
Methodology:
Data collection involved scraping prices from the first page of each identified website on two different days, using browsers with and without existing cookies and cache. This approach allowed us to compare data in a controlled environment, maintaining consistency in the network, location settings, and search parameters. We intended to provide a nuanced, data-driven perspective on how travel websites may adjust prices in response to user browsing behavior.
Full Data Collection Method:
- Scrape the prices available on the first page of each site.
- Complete this scrape twice, on different days to review whether the prices differed when one browser has been cleared.
- Compare the data collected from both devices.
Sites Used: The top travel companies/holidaymakers in the US were identified via the following sample source – www.semrush.com/trending-websites/us/travel-and-tourism
Devices: Use the same advice for each browser search, to minimize hardware differences.
- Browser A: Complete both price searches on the browser with existing cookies and cache
- Browser B: Clear all browser history, cookies, cache, and other site data between price searches.
Browsers: Use two different Google Chrome accounts.
Network: Use the same Wi-Fi network for all price searches to ensure IP consistency.
Location Settings: Verified that location settings (US VPN) were consistent when searching prices.
Search Parameters
Travel Starting Point (if applicable): JFK Airport, New York
Travel Destination:LAX Airport, Los Angeles
Travel Dates:12th July 2024 – 19th July 2024
No. of Travellers:2 Adults
Type of flight/accommodation:The most basic option available
Results used:First Page
1st Price Check Date:11th December 2023
2nd Price Check Date:13th December 2023