How can I perform a traceroute?
Last Updated: October 27, 2021
There are many troubleshooting utilities available over the internet to identify the issues related to the network. For example, PING, using the ping utility, you can check the host’s availability and determine the latency of the destination from the local system. Traceroute is one of the popular command-line utilities used to determine the network path to reach the destination server. If one of the routers in the route has a problem that you can anticipate using the traceroute command-line utility. Let’s learn, How can I perform a traceroute?
How does the traceroute work?
In this article, instead of going with too many technical-sounding phrases, we will help you understand how traceroute works in simple words!
Traceroute is a command-line utility that records network routes using ICMP packets until the packets reach the destination router. Every consecutive router will be given a specific number starting from 0, known as hop. At every hop, 3 ICMP packets will be delivered one by one, and once TTL (Time To Live) is reached, it will print the time in ms. This process will continue until the destination router is reached.
Syntax Of Traceroute Command (WINDOWS),
tracert <IP ADDRESS or DOMAIN NAME>Syntax Of Traceroute Command (MacOS),
traceroute <IP ADDRESS or DOMAIN NAME>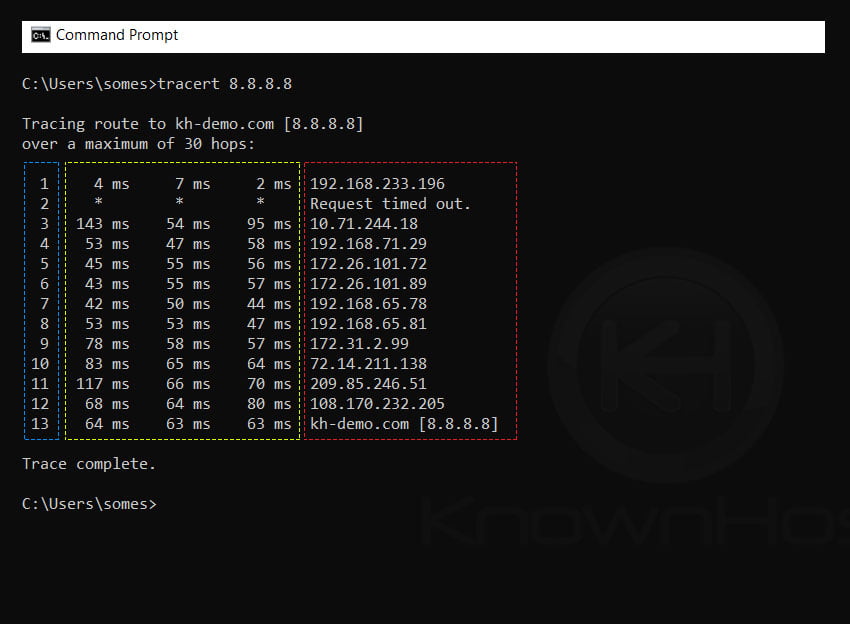
In the above example, you can see we are tracerouting 8.8.8.8 using the “tracert 8.8.8.8” command. The Blue section indicates the number of hops. The yellow section shows three ICMP packets. The red section indicates the IP address of the router. Also, you notice that hops are getting incremented by +1 consecutively, and it took a total of 13 hops to reach the destination.
How to read tracert output?
Example 1
C:\Users\somes>tracert 8.8.8.8

Tracing route to kh-demo.com [8.8.8.8]
over a maximum of 30 hops:

  1     4 ms     7 ms     2 ms  192.168.2.1
  2    48 ms    54 ms    95 ms  154.154.154.154
  3    53 ms    47 ms    58 ms  25.25.25.25
  4    68 ms    64 ms    80 ms  10.10.10.10
  5    64 ms    63 ms    63 ms  kh-demo.com [8.8.8.8]

Trace complete.
In the above example, you can see the packet travelled three routers, i.e. 154.154.154.154, 25.25.25.25, 10.10.10.10. Checking the packets’ latency, we can’t see the significant or abnormal spike in the latency or any unreachability of any router in the route. So, we can conclude that there is nothing suspicious or defect was found in the traceroute test.
Example 2
C:\Users\somes>tracert 8.8.8.8

Tracing route to kh-demo.com [8.8.8.8]
over a maximum of 30 hops:

  1     4 ms     7 ms     2 ms  192.168.233.196
  2     30      25        30    11.11.11.11.11
  3    45 ms    54 ms    95 ms   10.10.10.10
  4     *        *        *     Request timed out.
  5    45 ms    55 ms    56 ms  12.12.12.12
  6    43 ms    55 ms    57 ms  15.15.15.15.
  7    42 ms    50 ms    44 ms  16.16.16.16
  8    53 ms    53 ms    47 ms  17.17.17.17
  9    78 ms    58 ms    57 ms  18.18.18.18
 10    83 ms    65 ms    64 ms  19.19.19.19
 11   117 ms    66 ms    70 ms  20.20.20.20
 12    68 ms    64 ms    80 ms  21.21.21.21
 13    64 ms    63 ms    63 ms  kh-demo.com [8.8.8.8]

Trace complete.
In the above example, you could see that every hop’s latency behavior looks normal as there is no sudden spike nor unreachability. But, on the 4th hop, you could see that it is showing Request timed out. In this case, the 4th hop router didn’t respond to the ICMP packets but forwarded that packet to the next available router in the route. This is a typical situation as the network administrator might configure the router not to listen to ICMP requests and concentrate on transit traffic. Don’t worry, focus on your work!
Example 3
C:\Users\somes>tracert 8.8.8.8

Tracing route to kh-demo.com [8.8.8.8]
over a maximum of 30 hops:

1 8.8.8.8 reports: Destination net unreachable.
In the above example, you can see that once we tracert 8.8.8.8, it returned “Destination net unreachable,” which indicates the destination server is not reachable or is not available.
Example 4
C:\Users\somes>tracert 8.8.8.8

Tracing route to kh-demo.com [8.8.8.8]
over a maximum of 30 hops:

  1     4 ms     7 ms     2 ms  192.168.233.196
  2     *        *        *     Request timed out.
  3     *        *        *     Request timed out.
  4     *        *        *     Request timed out.
  5     *        *        *     Request timed out.
  6     *        *        *     Request timed out.
In the above example, you can see that once we perform traceroute to 8.8.8.8, the first ICMP packet sent to the private network 192.168.233.196, you receive the response. But, from the 2nd hop till the 6th hop, you could see that all the routers showing Request timed out error. In such a case, you can conclude the network has a significant issue and that needs to be administered by the networking professionals.
Example 5
C:\Users\somes>tracert 8.8.8.8

Tracing route to kh-demo.com [8.8.8.8]
over a maximum of 30 hops:

  1     4 ms     7 ms     2 ms  192.168.233.196
  2     30      25        30    11.11.11.11.11
  3    45 ms    54 ms    95 ms  10.10.10.10
  4    253 ms    *        *     11.11.11.11
  5    45 ms    55 ms    56 ms  12.12.12.12
  6     *       324 ms    *     15.15.15.15.
  7    253 ms    *       234 ms 16.16.16.16
  8    53 ms    53 ms     *     17.17.17.17
  9     *       58 ms    125 ms 18.18.18.18
 10     *       224 ms    *     19.19.19.19
 11   117 ms    66 ms    70 ms  20.20.20.20
 12    68 ms    224 ms   80 ms  21.21.21.21
 13    234 ms    63 ms    *     kh-demo.com [8.8.8.8]

Trace complete.
In the above example, we can see random packet drops and high latency across several of the 3 ICMP requests. This would be indicative of a networking issue between you and the destination. Typically in such situations, since it’s occurring at the beginning, this would be an issue with your ISP. If this started after their network, it’d be a middle network and if it’s occurring towards the end, it’s most likely the destination network.
So using the above example, the issue starts at the 4th hop. Depending on the network, this could be the transference from your ISP to a middle-man network. The example indicates that the middle-man network is most likely the cause for the disruption as the issue is seen cascading down.
If the packet loss and high latency started say around hop 10; this could be indicative of the destination network experiencing issues that would then need to be investigated by that appropriate party.
Till here, you understand what traceroute is, how to understand the tracert output. So, let us understand how and why the packets loss happens and determine whether the network has some issues. This is an advanced section that might not be helpful if you’re a beginner, but if you want to understand more about traceroute, this is worth reading and understanding.
Reasons behind packet loss
There are a couple of reasons which we can consider for packet loss in the network. We will see the three most presumable reasons which cause the packet loss in the network.
Route Congestion
If a core switch along the network is experiencing high traffic that exceeds its designed capacity, you can see such issues where that single hop is either A) high latency, B) dropping packets or C) both. When switches hit this level of an issue, they can start dropping excess traffic that they’re not able to handle.
Router Resources (CPU)
We use 8GB, 16GB, and 64GB of RAM on the regular system. We will have a bare minimum available RAM in the router, which is sufficient to use and serve the purpose. Suppose router/routers are busy handling the transit traffic and ultimately run out of memory. In that case, the router’s apparent behavior to ignore ICMP packets or ICMP TTL exceeded messages and served transit traffic requests. In such a scenario, you might see the packet loss in the hop/hops.
Firewall
In Example 2, we saw the 4th hop’s router didn’t respond to the ICMP packets and forwarded the request to the consecutive router in the route. In the same way, network administrators configure the firewall to ignore TTL exceeded ICMP packets. So, when you’re performing the traceroute, you could see specific router may ignore/block the ICMP packets and transfer the request to the next available router in route and the rest traceroute result should look fine.
Packet Rate Limits
On the typical shared hosting environment, you might notice that when X number of connections get established while performing some tasks through the FTP application, your IP address may get blocklisted. In the same way, when you are performing traceroute at 1 PPS (Packet Per Second), you should not have a problem, but when it exceeds the PPS sent from the source system to 5, 10, you most likely get packet loss or unreachability issues to the routers in the route.
Conclusion
Now that we’ve gone over how to perform a traceroute test. We have covered 5 examples that will surely help you learn how to read traceroute (tracert) results easily.
KnownHost offers 365 days a year, 24 hours a day, all 7 days of the week best in class technical support. A dedicated team is ready to help you with requests should you need our assistance. You’re not using KnownHost for the best web hosting experience? Well, why not? Check with our Sales team to see what can KnownHost do for you in improving your web hosting experience.